
Siloed troubleshooting just doesn’t cut it in data center provider environments
Many data centers provide IaaS by using a VMware technology platform that runs on computing and data storage (SAN) hardware. Furthermore, the IaaS is combined with the data center provider’s network and connectivity services. Usually, there are separate teams that monitor the VMware platform, storage, and network. However, this so-called silo approach isn’t beneficial for the business or customers.
Due to the separation of responsibilities and lack of information exchange, service performance issues or even outages are handled in parallel by all teams. And yes, there is routinely lots of back and forth and lost time because the issue can not be easily pinpointed.
Take a look at the following example as presented in the flow chart below.
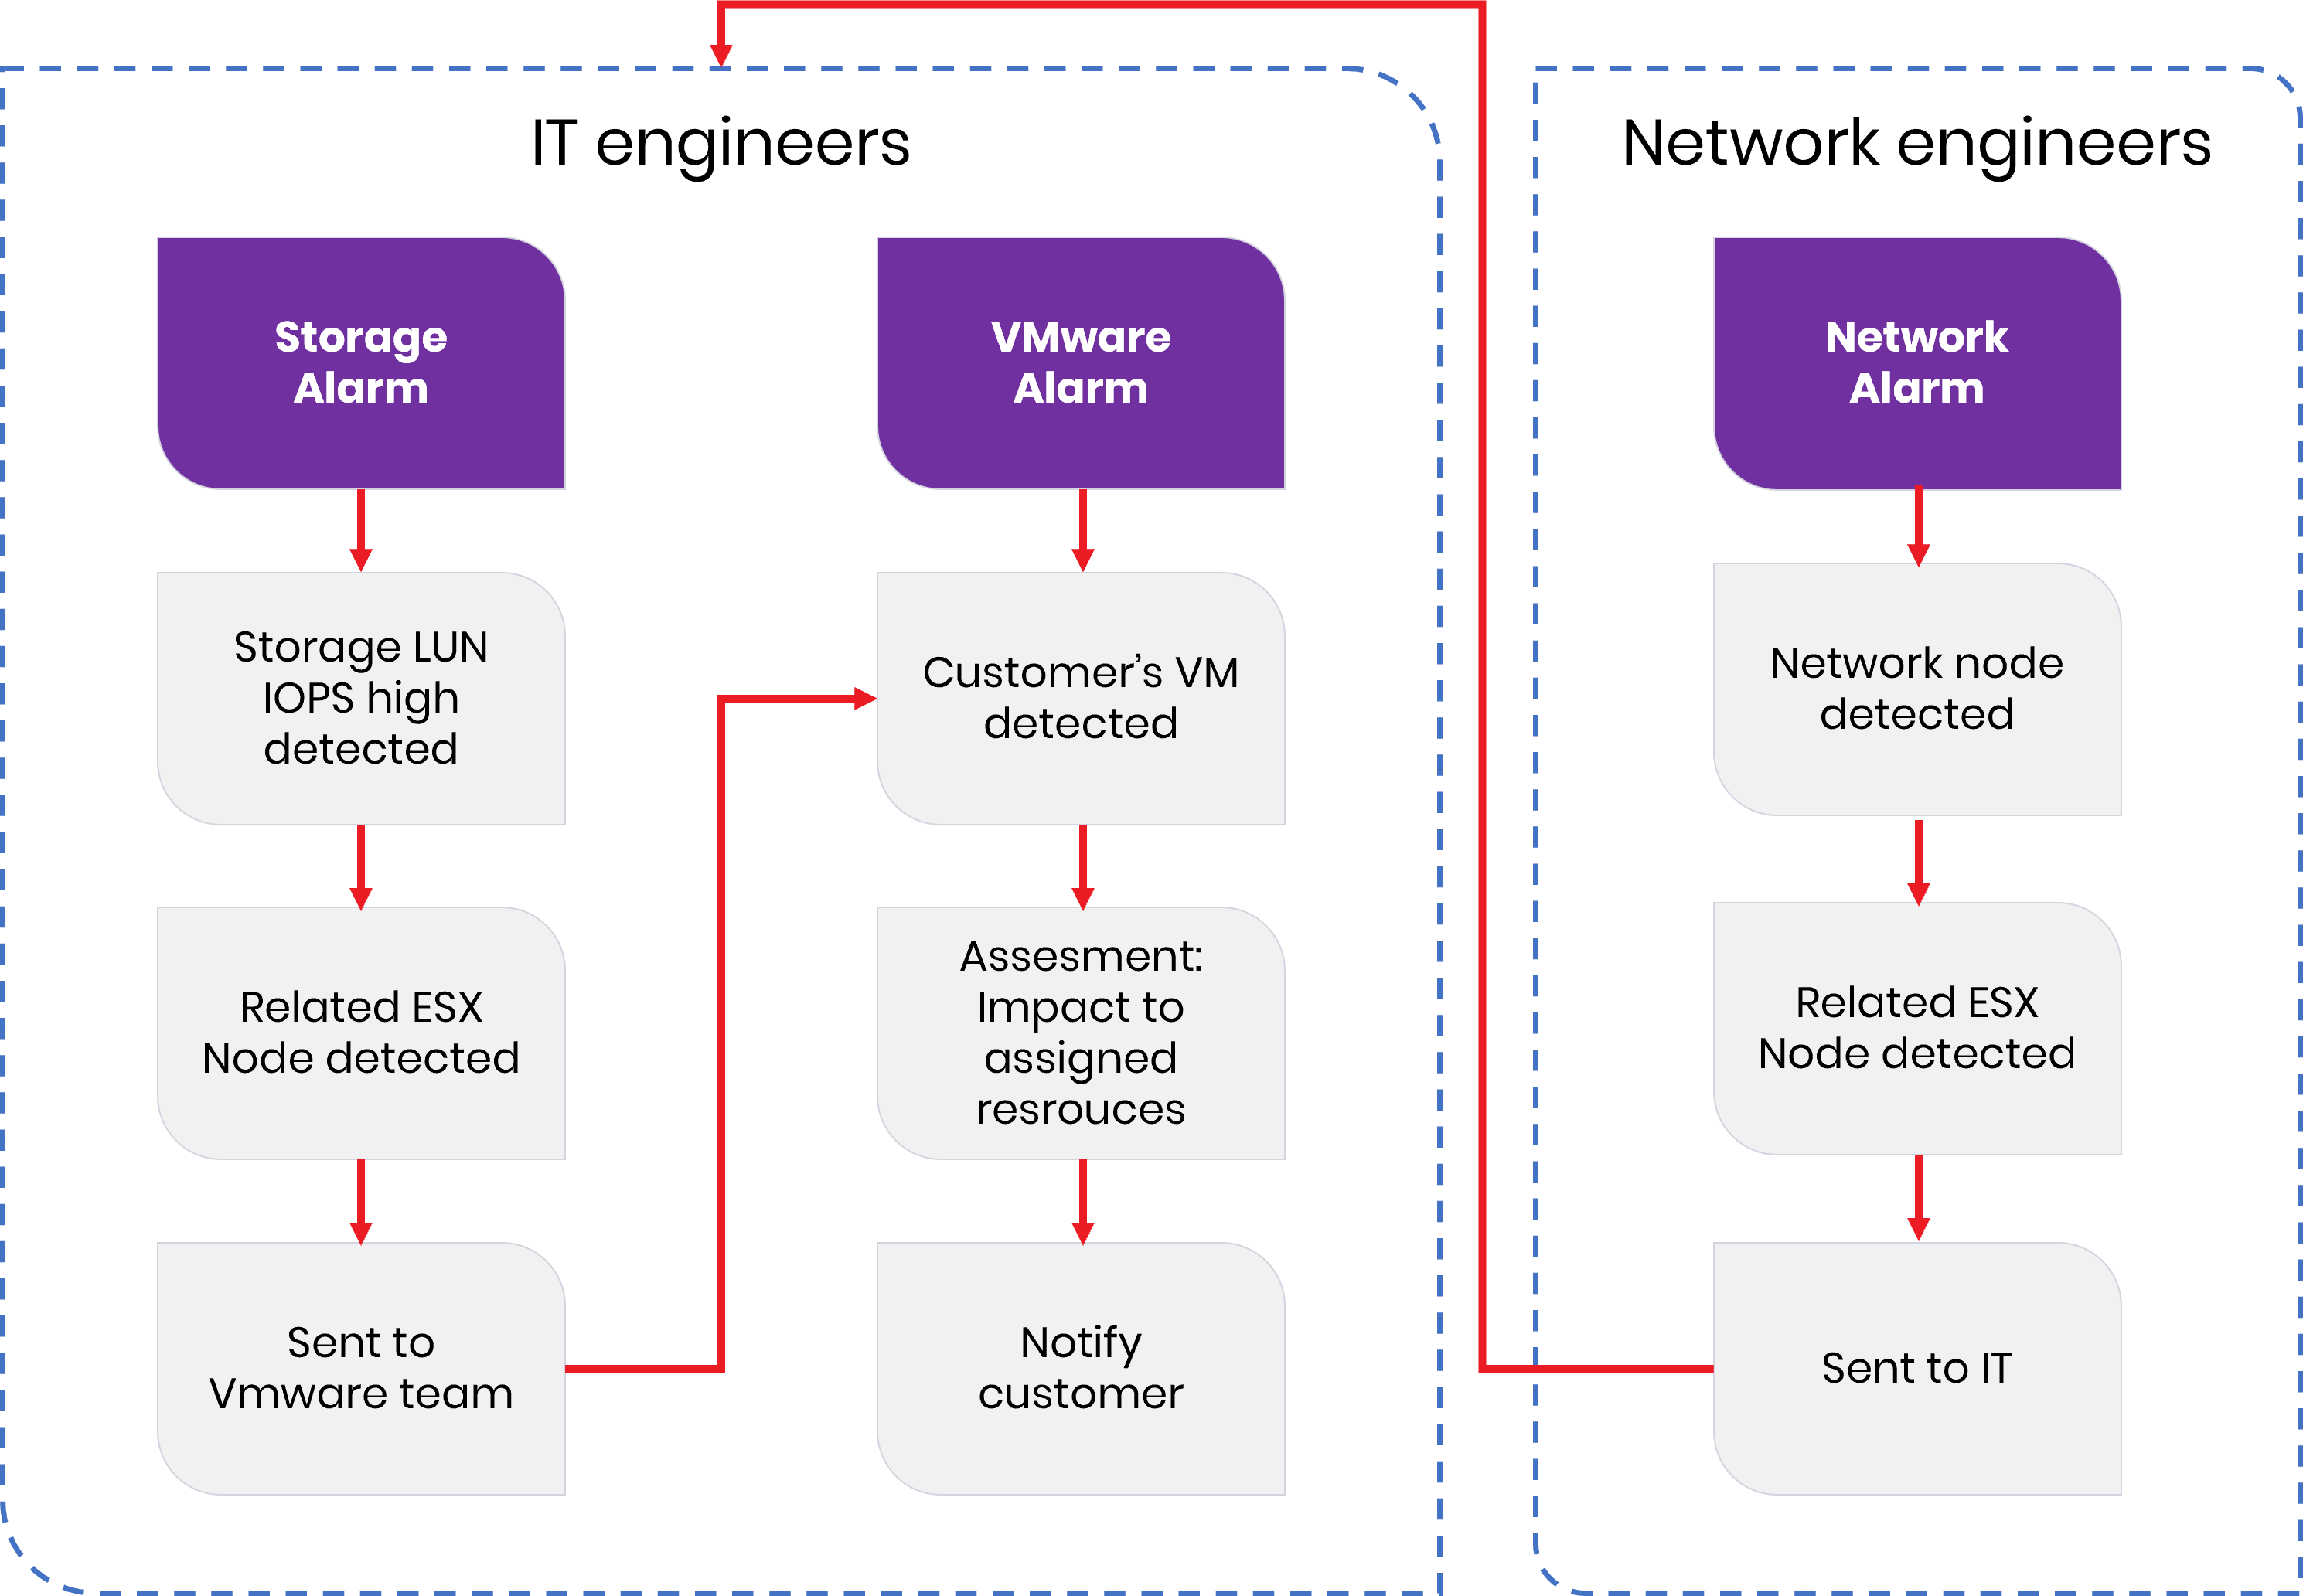
Now, imagine that a data center provider’s customer executes a job (e.g. starts data processing) that requires the high performance of all network, storage, and virtual machines. However, dedicated resources are insufficient and the customer is not aware of it. This knocks out some network elements and the IaaS platform. Separate network and platform alarms are triggered.
The networking team is aware of the networking alarm and starts troubleshooting. At the same time, the IT team sees the alarm from the platform and also starts troubleshooting both storage and computing resources. However, the teams are unaware of each other’s issues.
The data center provider’s reputation is at stake and bad customer experiences can quickly lead to dissatisfaction and the customer starts looking to move to a competitor. What’s the solution?
Get rid of the silo by placing the network and VMware platform under an umbrella
The most logical approach to the problem of having separate alarms for multiple domains caused by the same event is to correlate them, to have one single view of all the alarms in the data center. In other words, an umbrella approach is needed to consolidate all the alarms from all the domains in one monitoring system.
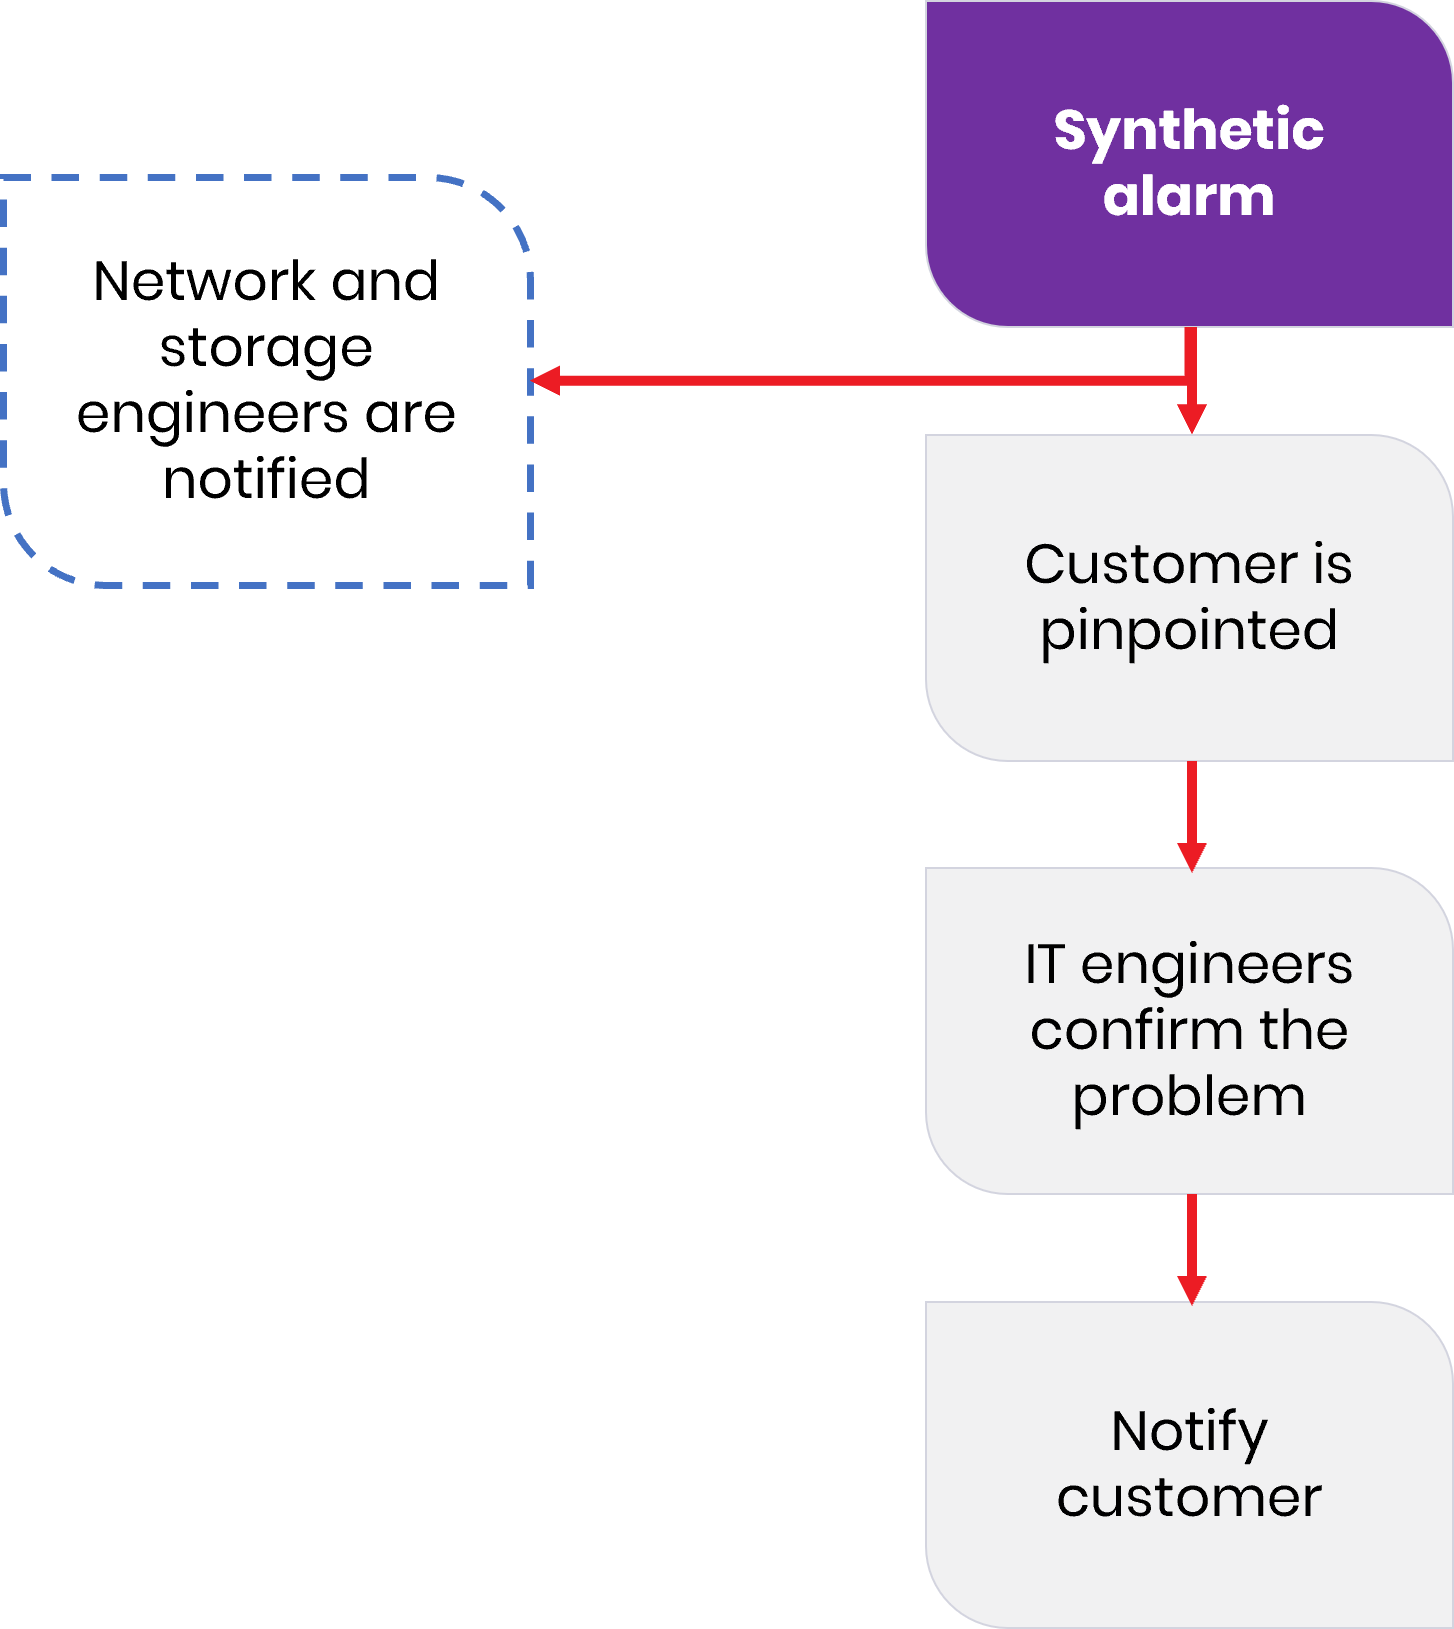
With consolidated alarms, an umbrella system easily applies correlation algorithms and concludes which alarms are interrelated. A synthetic alarm can be generated and seen by all technical teams. With alarm enrichment, an umbrella system can add information about the customer, its service, the customer’s behavior, and then the exact node (VMware machine), datastore, and network node that are impacted.
Back to the case described earlier, where a data center’s customer
has insufficient service resources … The team responsible for service support can immediately contact them, explain the situation, and thus prevent any escalation from the customer. The dedicated sales rep or account manager can also be informed of this new upsell opportunity. Now that’s great service excellence in practice. Check out the flow chart below that illustrates how simple the process can be.
This is how UMBOSS brings it all together
UMBOSS pulls all event and performance data from the VMware platform (hypervisor, computing, and storage hardware) and the underlying network, and consolidates them. The consolidated data is then enriched and correlation rules are applied. Data center engineers can then view all the performance data and alarms on the UMBOSS Portal which provides a 360° view of the network, services, and customers, all on a single screen.
UMBOSS uses its Automatic Discovery and Reconciliation (ADM) Module to discover all the virtualization platform resources, network, and storage resources. The discovered resources are put under monitoring by UMBOSS Fault Management (FM) and Performance Management (PM).
Data from the VMware platform and computing, storage, and network are collected by using dedicated data collectors. VMware-specific data is collected by using standard VMware REST API (e.g. from VMware vCenter) or through Kafka bus. Storage data is collected by integrating with a SAN’s controller’s API or even a simple CLI interface. Network data is collected using SNMP or Kafka bus when an SDN controller is in place. All integration points are implemented by UMBOSS certified engineers.
Time-saving benefits for data centers and their customers
With the proposed solution, network and IT engineers experience numerous benefits:
- Coordinated troubleshooting between network and IT teams thanks to a unified view of all domains
- Faster detection and resolution times
- Improved feedback to the customer and improved call deflection in the call center
- Service performance reports can be generated automatically and sent to customers
- Both the data center provider and the customer understand when a service upgrade is necessary
- All of the above points significantly increase customer satisfaction – the ultimate goal of service excellence efforts